
INTERMEDIATE MODULE
THIS COURSE WILL COVER MOST OF THE FOUNDAMENTALS THAT WILL ENALBE
YOU TO GET STARTED INTO TRADING WITH EASE AND HIGH CONFIDENCE

UNIT II: INTERMEDIATE MODULE
The stock market serves as a dynamic and complex arena where investors buy and
sell shares of publicly traded companies, aiming to generate pro ts and build wealth.
Functioning as a critical component of the global nancial system, the stock market
facilitates the ow of capital, enabling businesses to raise funds for expansion and
innovation while offering individuals the opportunity to invest in the growth of these
enterprises
- Understanding the fundamental principles and mechanics of the stock market is
essential for anyone looking to participate in this pivotal aspect of the economy.

CHAPTER I: MARKET, STOCKS, TRADING

Chapter II : TYPES OF ANALYSIS
Several key factors influence the stock market, shaping its movements and
determining investor sentiment. Economic indicators, such as GDP growth rates,
employment figures, and inflation levels, provide insights into the overall health of the
economy and can significantly impact stock prices. Corporate performance, reflected
in earnings reports, revenue growth, and profit margins, directly affects the valuation
of individual stocks
- Understanding these factors is essential for investors seeking to navigate the
complexities of the stock market and make informed decisions
Accounting and financial statements are vital components of any business, playing a
crucial role in its financial health and decision-making processes. Accounting involves
the systematic recording, analyzing, and reporting of financial transactions, which
ensures that a company's financial activities are accurately documented and
managed.
- By providing a clear picture of a company's financial status, accounting and
financial statements also aid in strategic planning, budgeting, and risk
management, ultimately contributing to the sustainable success of the business

CHAPTER III: ACCOUNTING AND
FINANCIAL STATEMENTS

CHAPTER IV: TRADING CHARTS
Trading charts are essential tools for traders in financial markets, providing a visual
representation of market data that enables informed decision-making based on
historical and real-time price movements. By displaying the price movements of an
asset over time, charts help traders identify patterns, trends, and anomalies, which are
crucial for determining potential entry and exit points. Technical analysis relies heavily
on charts, utilizing various indicators such as moving averages, Relative Strength
Index (RSI), and Bollinger Bands to forecast future price movements.
- Furthermore, charts help pinpoint key support and resistance levels, which are
critical for setting stop-loss and take-prot orders, ultimately aiding in risk
management and enhancing trading eciency.
KEY LESSONS
- Market Value & Types
- Market Performance
- Types of Analysis (Psychological, Fundamental, Technical)
- Diversification
- Types of Alligators in Trading
- Pros & Cons in Buying Stocks
- Investment Strategies
CHAPTER I: FACTORS UNDER STOCK MARKET

THE PLACE: STOCK MARKET
The stock market is a platform where
investors buy and sell shares of publicly
traded companies. It facilitates the
exchange of ownership in companies,
allowing for the raising of capital,
liquidity for investors, and price discovery
based on supply and demand dynamics.

THE ACT:
STOCK MARKET
Stock trading involves buying and selling
shares of publicly traded companies,
typically through stock exchanges or
over-the-counter markets. Traders aim to
profit from price fluctuations, which can
result from factors like company
performance, market trends, economic
indicators, and geopolitical events. There
are different approaches to stock trading,
including day trading, swing trading, and
long-term investing, each with unique
strategies and risk proles. Traders use
various tools and techniques, such as
technical and fundamental analysis, to
make informed decisions and optimize
returns

THE REGULATION: STOCK MARKET
A stock index is a measurement of the
performance of a group of selected
stocks, representing a specic market or
sector. It provides a benchmark for
investors to gauge market trends and
compare individual stock performance.
Buying Stocks now and why (?)
Investors buy stocks for several reasons:
1. Capital Appreciation: Potential to earn prot as stock prices increase over time.
2. Dividends: Regular income from company prot distributions.
3. Ownership: Partial ownership in a company, including voting rights.
4. Diversification: Spreading investment risk across different sectors and companies.
5. Inflation Hedge: Stocks can provide returns that outpace inflation.
6. Long-term Growth: Historically, stocks have offered higher long-term returns compared to other asset classes.
CHAPTER II: TYPES OF ANALYSIS IN TRADING

PSYCHOLOGICAL ANALYSIS
Technical analysis is vital in trading for several reasons. It involves evaluating historical price and volume data to identify patterns and trends that can forecast future price movements. This analysis helps traders make informed decisions by providing insights into market sentiment and the potential direction of prices. By identifying support and resistance levels, technical analysis aids in determining optimal entry and exit points for trades, thereby enhancing profit potential and minimizing losses
- Technical analysis is crucial for developing effective trading strategies, managing risk, and making objective, data-driven decisions, ultimately leading to more consistent and protable trading outcomes.

FUNDAMENTAL ANALYSIS
Psychological analysis in trading is crucial for several reasons. It helps traders understand and manage their emotions, leading to more rational and disciplined trading decisions. By recognizing emotional biases, traders can improve their risk management and avoid behaviors such as overtrading or taking excessive risks.
- Psychological analysis is a powerful tool in the realm of trading. By understanding and addressing the psychological factors that inuence trading decisions, we can enhance performance, manage risks more effectively, and achieve greater success in the markets. As we move forward, let us embrace the insights provided by psychological analysis and integrate them into our trading practices.

TECHNICAL ANALYSIS
Fundamental analysis is essential in trading for several reasons. It involves evaluating a company’s financial health, economic conditions, and industry trends to determine the intrinsic value of its stock. Fundamental analysis also considers macroeconomic factors, such as interest rates, inflation, and economic growth, which can impact market conditions and company performance. By understanding these broader economic indicators, traders can anticipate market trends and adjust their strategies accordingly.
- This approach supports long-term investment strategies, enhances risk management, and contributes to more stable and protable trading outcomes uncertainties effectively, and achieve a balanced approach to risk management in pursuit of their goals.
CHAPTER III: ACCOUNTING AND FINANCIAL
STATEMENTS
Complex Financial Statement Analysis
Basic Investment
Decision-Making
Horizontal analysis is a key technique used in trading and nancial analysis, offering
several important benets. This method involves comparing nancial data over
multiple periods to identify trends, growth patterns, and potential issues. Here are the
main reasons why horizontal analysis is important in trading:
- Trend Identification
- Performance Evaluation
- Comparison with Industry Standards
- Forecasting
- Identication of Anomalies
- Risk Management
- Enhanced Decision-Making
Vertical analysis is a vital tool in trading and financial analysis, providing numerous
benefits that aid traders in understanding the financial health and performance of a
company. This method involves analyzing financial statements by expressing each
item as a percentage of a base figure within the same period, allowing for a clear and
proportional view of financial data. Here are the key reasons why vertical analysis is
important in trading:
- Proportional Insights
- Trend Identification
- Simplified Financial Statements
- Evaluating Profitability
- Comparison Across Companies
- Highlighting Key Metrics
- Efficiency and Cost Control
- Risk Assessment

VERTICAL ANALYSIS
Ratio analysis is a critical tool in trading, offering several significant benefits that help
traders assess the financial health, performance, and valuation of companies. This
method involves calculating and interpreting various financial ratios derived from
financial statements. Here are the key reasons why ratio analysis is important in
trading:
- Performance Measurement
- Solvency Evaluation
- Efficiency Metrics
- Trend Analysis
- Risk Management
- Liquidity Assessment
- Profitability Analysis
- Valuation Insights
- Comparison Across Companies
- Informed Decision-Making

RATIO ANALYSIS
Return on Investment (ROI)
Return on Investment (ROI) is a crucial metric in both business and trading, providing essential insights into the eciency and
protability of investments. It quanties the nancial gain or loss generated by an investment relative to its cost, allowing investors and
businesses to measure performance over time. By comparing the ROI of different opportunities, investors can make informed decisions
about where to allocate resources for the highest returns. This standardized metric is invaluable for comparing protability across
various investments, helping assess associated risks and ensuring balanced choices. Businesses use ROI for strategic planning,
prioritizing projects with the highest returns to optimize capital use.

Leverage Ratios
Leverage ratios are critical metrics in
both business and trading, offering
valuable insights into a company's
nancial structure and risk prole. These
ratios, such as debt-to-equity and debtto-assets, measure the extent to which a
company utilizes borrowed funds to
nance its operations. High leverage
indicates that a company relies heavily
on debt, which can amplify returns in
favorable conditions but also increases
nancial risk during downturns.

Efficiency Ratios
Efficiency ratios are crucial indicators in
both business and trading, providing
insights into how effectively a company
utilizes its assets and manages its
operations. These ratios, such as
inventory turnover, asset turnover, and
accounts receivable turnover, measure
the efficiency with which a company
converts its resources into revenue and
profits.

Market Ratios
Market ratios are indispensable tools for
investors, traders, and businesses alike,
providing critical insights into valuation,
investor sentiment, and financial
performance. They enable informed
decision-making, facilitate benchmarking
against industry standards, and
contribute to ecient capital allocation
and strategic planning.

RISK MANAGEMENT
Risk management is the cornerstone of successful trading, essential for navigating the uncertainties of financial markets while safeguarding capital and ensuring sustainable profitability. Risk management involves identifying, assessing,
and mitigating potential risks associated with trading activities. By implementing robust risk management strategies, traders can protect their capital from significant losses that could otherwise threaten their ability to continue trading. This proactive
approach not only preserves capital but also promotes consistency in trading performance over the long term.
- Effective risk management helps traders maintain discipline by setting predefined risk parameters, such as position sizes and stop-loss levels, which guide decision-making and mitigate emotional biases during volatile market
conditions.
TYPES OF DIVERSIFICATION
ASSET CLASS DIVERSIFICATION
Asset diversication is a
crucial strategy in trading
that helps mitigate risk and
enhance the potential for
returns. By spreading
investments across various
asset classes, such as
stocks, bonds, real estate,
and commodities, traders
can protect their portfolios
from the adverse effects of
market volatility.
Diversication reduces the
impact of a poor-performing
asset because the losses in
one area can be offset by
gains in another.

SECTOR DIVERSIFICATION
Sector diversification is a
vital aspect of trading that
plays a key role in reducing
risk and optimizing returns.
By spreading investments
across different sectors of
the economy, such as
technology, healthcare,
nance, and consumer
goods, traders can protect
their portfolios from sector specifc downturns.

GEOGRAPHIC DIVERSIFICATION
Geographic diversification is
an essential strategy in
trading that enhances
portfolio resilience and
optimizes returns by
spreading investments
across different regions and
countries. By investing in a
variety of geographic
markets, traders can mitigate
the risk associated with
regional economic
downturns, political
instability, and other localized
events.

CURRENCY DIVERSIFICATION
Currency diversification is a
critical strategy in trading
that helps protect
investments from currency
risk and enhances overall
portfolio stability. By holding
assets in multiple currencies,
traders can mitigate the
adverse effects of currency
fluctuations and exchange
rate volatility. Different
currencies often move
independently due to varying
economic conditions, interest
rates, and geopolitical
factors.
CHAPTER IV: TRADING CHART PATTERNS
TRADING CHARTS
Trading charts provide a clear, concise way to monitor market behavior, making it
easier to react swiftly to changing conditions. This real-time tracking is crucial for
managing risk and maximizing prots, as it helps traders to stay attuned to market
volatility and adjust their strategies accordingly. Charts also assist in comparing the
performance of different assets, helping traders to diversify their portfolios effectively.
In summary, trading charts are vital for developing a comprehensive understanding of
market dynamics, enhancing analytical precision, and supporting strategic trading
decisions.
- Additionally, charts facilitate the application of technical analysis, enabling
traders to utilize various indicators such as moving averages, Relative Strength
Index (RSI), and Bollinger Bands to make informed predictions about future price
movements.

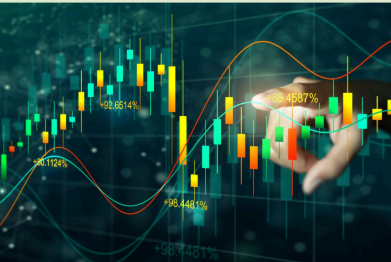
CANDLE STICK CHART
Each "candlestick" on the chart represents four key data points: the opening price, the
closing price, the highest price, and the lowest price during that time frame. The body
of the candlestick illustrates the difference between the opening and closing prices,
while the wicks (or shadows) extend to the highest and lowest prices. If the closing
price is higher than the opening price, the candlestick body is typically colored green
or white, indicating a bullish market; if the closing price is lower, the body is colored
red or black, signaling a bearish market.
- Candlestick patterns, such as dojis, hammers, and engulng patterns, provide
further insights into potential market reversals or continuations, making
candlestick charts an essential tool for technical analysis and strategic decisionmaking in trading.
A bar chart is a widely used tool in trading that provides a clear and concise visual
representation of an asset's price movements over a specic period. Each bar on the
chart represents four critical pieces of information: the opening price, the closing
price, the highest price, and the lowest price during that timeframe. The vertical line of
the bar indicates the range between the highest and lowest prices, while horizontal
lines extending from the sides show the opening price (on the left) and the closing
price (on the right).
- This type of chart is particularly useful for technical analysis, enabling traders to
make informed decisions based on historical price data and trends. Overall, bar
charts are an essential tool for tracking and analyzing market performance in a
straightforward and effective manner

BAR CHART
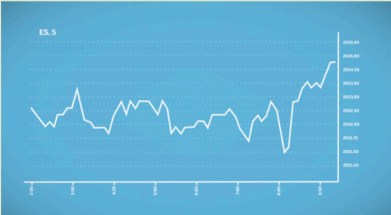
A line chart is a fundamental and straightforward tool in trading that illustrates an
asset's price movements over time using a continuous line. This chart type plots a
series of data points, typically closing prices, connected by a line, making it easy to
visualize the general direction and trends of the market.
- Despite their simplicity, line charts provide valuable insights for trend analysis,
helping traders make informed decisions by highlighting key patterns and
changes in market behavior. Their clear and easy-to-understand format makes
line charts are an essential tool for both novice and experienced traders aiming to analyze and interpret market data effectively
LINE CHART
APPROACH READING CHART

TIME-BASED CHART

TRADE-BASED CHART
Time-based charts are essential in trading for several key
reasons, providing traders with a structured and detailed view of
market activity over specied intervals. These charts plot price
movements over consistent time periods, such as minutes,
hours, days, or weeks, allowing for comprehensive analysis and
informed decision-making.
- Trend Identification
- Market Timing
- Consistency and Comparability
- Volume and Volatility Analysis
- Technical Analysis
- Scalability
Trade-based charts, also known as tick charts, are a valuable
tool in trading that offer a unique perspective by plotting price
movements based on a specied number of trades rather than
time intervals. This type of chart provides several advantages
that can enhance trading strategies and decision-making
- Granular Insight
- True Market Activity
- Volatility Filtering
- Volume Analysis
- Dynamic Market Analysis
- Enhanced Pattern Recognition
- Adaptive Trading
Moving Averages
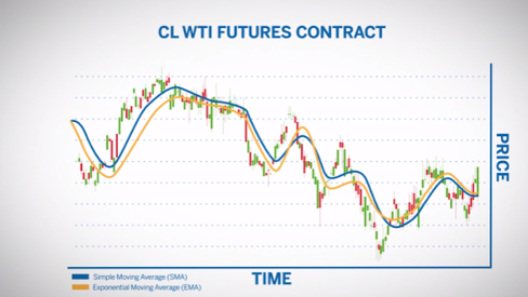
SIMPLE MOVING AVERAGES
The simple average moving, commonly referred to as the simple
moving average (SMA), plays a pivotal role in trading due to its
ability to smooth out price data and provide a clearer view of
market trends. By calculating the average price of a security over
a specific number of periods, the SMA helps traders identify
potential buy and sell signals. It eliminates short-term
fluctuations, making it easier to discern the underlying trend.
- Furthermore, when combined with other indicators, the
SMA can help conrm trends and reduce the likelihood of
false signals, thereby improving the overall decision-making
process in trading.
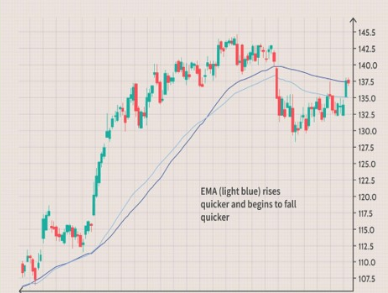
EXPONENTIAL MOVING AVERAGES
The exponential moving average (EMA) is a crucial tool in
trading, offering several advantages over its simpler counterpart,
the simple moving average (SMA). Unlike the SMA, the EMA
assigns greater weight to more recent prices, making it more
responsive to recent market changes.
- Overall, the EMA's adaptability and precision make it a
fundamental component of effective trading analysis.
WHY DO WE NEED TO UNDERSTAND THIS MOVEMENT?
Understanding moving averages is vital for traders and investors as they provide a foundational tool for analyzing price trends and
making informed decisions. Moving averages, including the simple moving average (SMA) and exponential moving average (EMA), help
smooth out price data, reducing the impact of short-term volatility and highlighting the underlying trend. By averaging out price
movements over a specied period, they allow traders to identify trends, determine potential support and resistance levels, and
generate buy or sell signals.
TRADING PATTERNS
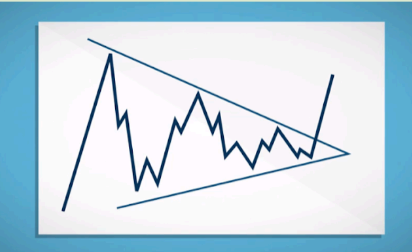
TRIANGLE
Triangle patterns in trading are formed by the convergence of price movement within
two trendlines, which typically indicate a period of consolidation before the price
breaks out. There are three types of triangle and they are the following:
- Symmetrical (Lower Highs Higher lows)
- Descending Triangles (Low and High Constant)
- Ascending Triangles (Sustained Highs and Higher Lows)
Rectangle patterns in trading form during periods of consolidation when the price of a
security oscillates within a horizontal range, bounded by parallel support and
resistance levels. This pattern reflects a market equilibrium where supply and demand
are relatively balanced, causing the price to repeatedly bounce between these two
levels.
- The direction of the breakout provides traders with critical information about the
future price movement, allowing them to position their trades accordingly.
Recognizing rectangle patterns enables traders to anticipate potential price
movements and make more informed trading decisions.

RECTANGLE

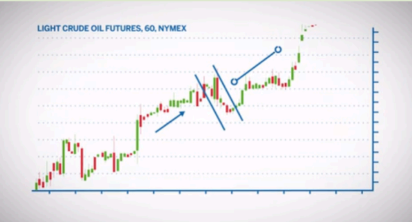
FLAGS
The flag pattern is a crucial tool in trading, offering significant insights into potential
trend continuation and providing traders with strategic entry and exit points. Typically
formed during a pause in a strong price movement, the flag pattern consists of a brief
period of consolidation that resembles a small parallelogram, angled opposite to the
prevailing trend.
- The importance of volume cannot be overstated, as a breakout with high volume
confirms the pattern's validity, increasing the probability of a successful trade.
Overall, understanding and utilizing flag patterns can significantly enhance a
trader’s ability to capitalize on ongoing trends while effectively managing risk.
Pennant patterns in trading form during periods of consolidation following a strong
price movement, characterized by converging trendlines that create a small
symmetrical triangle. This pattern begins with a sharp price move known as the
agpole, driven by a signicant increase in trading volume, indicating strong market
momentum.
- Recognizing pennant patterns helps traders identify potential continuation
signals and plan their trades accordingly, offering clear entry points at the
breakout and stop-loss levels just outside the converging trendlines, thereby
enhancing trading strategies and risk management.
PENNANTS
Technical Patterns: REVERSALS

Head and Shoulders
The head and shoulders pattern is highly signicant in trading due to its ability to
signal potential trend reversals. It consists of three peaks: the central peak (head) is
higher than the two surrounding peaks (shoulders), creating a distinctive formation.
This pattern is crucial as it often indicates a shift in market sentiment: a head and
shoulders top suggests a potential downturn following an uptrend, while an inverse
head and shoulders indicates a potential uptrend after a downtrend.
- The pattern's reliability lies in its ability to provide clear entry and exit points,
supported by volume and other technical indicators. However, traders must also
be cautious of false signals and ensure robust risk management practices.
Overall, the head and shoulders pattern remains a fundamental tool for technical
analysts seeking to anticipate and capitalize on market reversals.
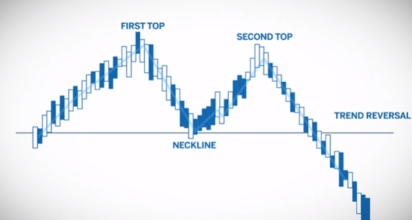
Double Tops and Bottoms
Double tops and double bottoms are key chart patterns in technical analysis that hold
significant importance for traders. A double top forms when an asset price reaches a
high, retraces, and then attempts to reach that same high again, failing to break
through, thus signaling a potential reversal to the downside.
- Overall, double tops and double bottoms remain integral to technical analysis,
offering valuable insights into potential market reversals and opportunities for
traders to capitalize on changing market dynamics.
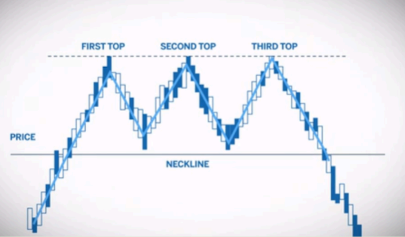
Triple Tops and Bottoms
Triple tops and triple bottoms are advanced chart patterns in technical analysis that
carry significant importance for traders seeking to identify potential trend reversals. A
triple top occurs when the price reaches a peak three times at approximately the
same level, failing to break higher each time, which often signifies a strong resistance
level and a potential reversal to the downside.
- Overall, these patterns serve as valuable tools for technical analysts, offering
insights into potential shifts in market sentiment and opportunities to prot from
trend reversals.
Support and Resistance
Support and resistance levels are fundamental concepts in technical analysis, playing a crucial role in guiding trading decisions across
various financial markets. Support represents a price level where a downtrend is anticipated to pause due to a concentration of buying
interest, preventing the price from falling further. Resistance, on the other hand, signifies a price level where an uptrend is expected to
pause as selling pressure increases, preventing the price from rising further.
Support and Resistance
lines
While support and resistance lines are valuable tools, they are
not infallible and can break under certain market conditions or
events. Traders should always consider combining technical
analysis with other indicators and fundamental analysis to
validate their trading decisions.
Support And Resistance
Role Reversals
Support and resistance role reversal plays a crucial role in
technical analysis by signaling potential trend reversals,
providing strategic entry and exit points, and helping traders
manage risk. It serves as a cornerstone for traders' decision-making processes, contributing to more informed and effective
trading strategies in dynamic market environments.
Resistance
Becoming Support

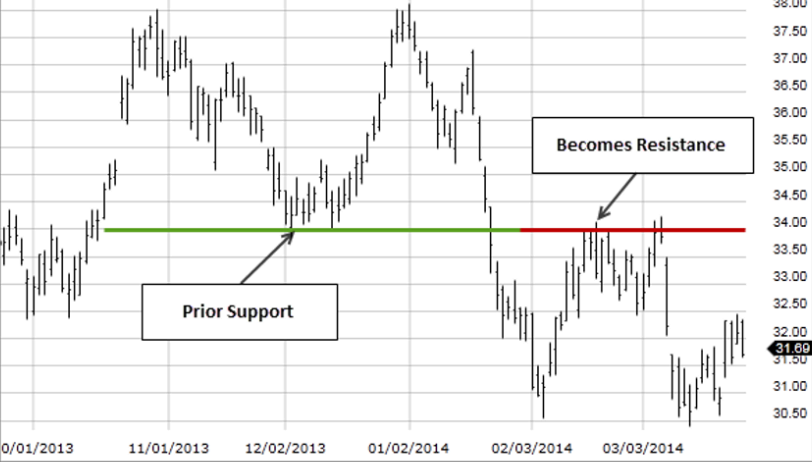
Support Becoming
Resistance
INVESTMENT DISCLAIMER
The content provided on this website is for informational purposes only and does not constitute financial, investment, or other
professional advice. Investing in nancial markets involves risks, including the potential loss of capital. The value of investments may
fluctuate, and past performance is not indicative of future results.
You should not rely solely on the information provided here for your investment decisions. It is strongly recommended that you seek
advice from a licensed nancial advisor who can consider your individual nancial situation and objectives.
We strive to ensure that the information presented is accurate and up-to-date, but we do not guarantee its completeness or accuracy.
We disclaim any liability for any loss or damage arising from the use of this information.
By accessing this website, you agree to assume full responsibility for your investment decisions and acknowledge that you have read
and understood this disclaimer.
Frequently Asked Questions (FAQ's)
What is the
stock market,
and why is it
important?
The stock market is a dynamic platform
where investors buy and sell shares of
publicly traded companies. It plays a
crucial role in the global financial system
by facilitating the flow of capital, allowing
businesses to raise funds for expansion
and innovation. For individuals, the stock
market offers opportunities to invest in
the growth of companies, generate
profits, and build wealth. Understanding
its fundamental principles and
mechanics is essential for anyone
looking to participate in this vital aspect
of the economy.
What are the
key factors that
influence the
stock market?
Several key factors shape the
movements of the stock market and
determine investor sentiment. Economic
indicators such as GDP growth rates,
employment figures, and inflation levels
provide insights into the overall health of
the economy and can signi cantly
impact stock prices. Corporate
performance, reflected in earnings
reports, revenue growth, and profit
margins, directly affects the valuation of
individual stocks. Additionally, market
sentiment, which encompasses investor
perceptions and reactions to news,
events, and trends, also plays a crucial
role in influencing stock prices.
Understanding these factors helps
investors navigate the complexities of
the stock market and make informed
decisions.
What are the
advantages and
disadvantages of
investing in the
stock market?
Investing in the stock market offers
several advantages. It provides the
potential for wealth growth through
capital appreciation and dividends,
allowing investors to accumulate wealth
over time. The stock market also offers
diversification opportunities, enabling
investors to spread their investments
across various sectors and companies,
thereby reducing risk. Moreover, the
stock market's liquidity allows for the
easy buying and selling of stocks,
providing flexibility and quick access to
cash. Additionally, it serves as an
economic indicator, reflecting the health
of the economy and investor condence.
However, investing in the stock market
also comes with disadvantages. Market
volatility can lead to signi cant price
uctuations, resulting in potential losses.
The stock market is also susceptible to broader economic conditions and downturns, which can negatively impact investments. Effective risk management requires careful analysis and strategic decision-making, making it essential for investors to understand both the
advantages and disadvantages of stock market investing.
ASK A PROFESSIONAL
Never pass an opportunity to learn from our experts, it can also give you an edge in your trading journey and endeavors. Why not Ask a
MENTOR or someone with experience for this manner today